Course
Other
Study Pack
Set 19 Integrated Control Of The Cardiovascular System
Question 1
(Multiple Choice)
Free
In the cardiac and vascular function curves shown below,the solid curves represent the control state: 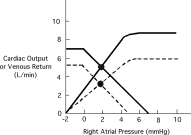 The shift in these curves,illustrated by the dashed lines,is best explained by:
The shift in these curves,illustrated by the dashed lines,is best explained by:A)Administration of positive inotropic agent.
B)Decrease in peripheral vascular resistance.
C)Infusion of isotonic saline.
D)Increase in peripheral vascular resistance.
E)Administration of a negative inotropic agent.
Answer
Question 2
(Multiple Choice)
Free
A well-trained athlete has prepared to run in the Boston marathon.Your purpose is to study how this athlete's cardiovascular system adapts to the strenuous demands of the race.Assume that just before the athlete runs,measurements of heart rate (60 beats/minute),blood pressure (110/80 mm Hg),and cardiac output (4.2 L/minute)are recorded. Estimate the athlete's stroke volume.
A)42 mL
B)55 mL
C)70 mL
D)82 mL
E)90 mL
Answer
Question 3
(Multiple Choice)
Free
A well-trained athlete has prepared to run in the Boston marathon.Your purpose is to study how this athlete's cardiovascular system adapts to the strenuous demands of the race.Assume that just before the athlete runs,measurements of heart rate (60 beats/minute),blood pressure (110/80 mm Hg),and cardiac output (4.2 L/minute)are recorded. Assume that central venous pressure is 0 mm Hg,and calculate the athlete's peripheral resistance.
A)42.8 mm Hg/L/minute
B)32.1 mm Hg/L/minute
C)21.4 mm Hg/L/minute
D)10.7 mm Hg/L/minute
E)4.3 mm Hg/L/minute
Answer