Course
Cell Biology
Study Pack
Set 15 Cell Signaling
Question 1
(Short Answer)
Free
In the following graphs, the cellular response, as measured in real time by the concentration of a certain active effector protein, is plotted over time for five cell types (A to E) that are treated with three different concentrations of a signal molecule. During the time period indicated by the horizontal gray bar, the signal molecule is present in the culture media at a concentration of 1 nM (dotted curve), 5 nM (gray curve), or 25 nM (solid curve). Answer the following question(s) based on these graphs.
-Which of the cell types A to E shows a response with the highest persistence?
A)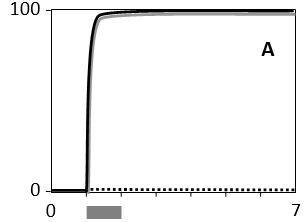
B)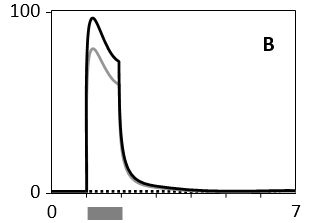
C)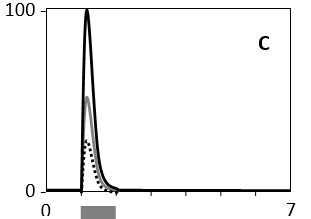
D)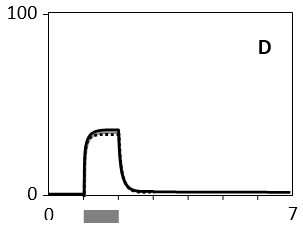
E)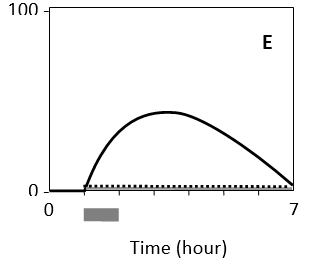
-Which of the cell types A to E shows a response with the highest persistence?
A)
B)
C)
D)
E)
Answer
This cell type seem...
View full Answer
Question 2
(Multiple Choice)
Free
Whereas the cholera toxin ADP-ribosylates the α subunit of stimulatory G protein (Gs), thereby blocking GTP hydrolysis, pertussis toxin ADP-ribosylates the α subunit of inhibitory G protein (Gᵢ) and prevents interaction with the receptor. What is the effect of these toxins on the concentration of intracellular cAMP?
A) Cholera toxin tends to increase cAMP concentration, whereas pertussis toxin tends to decrease cAMP concentration.
B) Cholera toxin tends to decrease cAMP concentration, whereas pertussis toxin tends to increase cAMP concentration.
C) They both tend to increase cAMP concentration.
D) They both tend to decrease cAMP concentration.
Answer
Question 3
(Short Answer)
Free
A certain effector protein can be activated by phosphorylation at a key tyrosine residue. An upstream kinase rapidly phosphorylates this tyrosine in the presence of a signal. However, the kinase also phosphorylates and activates a slow-acting phosphatase that can dephosphorylate the phosphotyrosine. Which curve in the following graph would you expect to represent the activity of the effector molecule over time? The input signal is present during the period indicated in gray. The dashed line represents the response in the absence of the phosphatase. 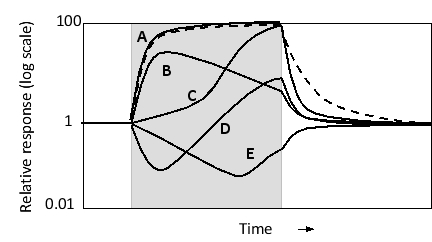
Answer
The upstream kinase both acti...
View full Answer