Course
General Biology
Study Pack
Set 53 Populations And Life History Traits
Question 1
(Multiple Choice)
Free
To measure the population of lake trout in a 250-hectare lake, 500 individual trout were captured using nets and marked with a fin clip, then returned to the lake. The next week, the trout capture was repeated, and out of the 200 lake trout that were caught, 50 had fin clips. Using the mark-recapture estimate, the lake trout population size is predicted to be closest to which of the following?
A) 200
B) 400
C) 1,600
D) 2,000
Answer
Question 2
(Multiple Choice)
Free
Use the graph to answer the following question. 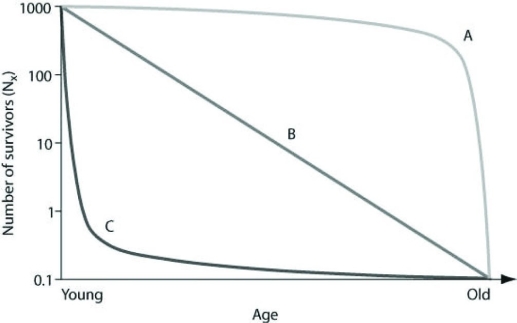 Which of the following examples are plausible explanations for a population that would produce curve A in the figure?
Which of the following examples are plausible explanations for a population that would produce curve A in the figure?A) ongoing predation of pocket gophers throughout their lives
B) susceptibility of middle-aged humans to heart disease
C) higher predation success by wolves of older, slower elk
D) high seedling mortality in sunflowers
Answer
Question 3
(Multiple Choice)
Free
Use the graph to answer the following question. 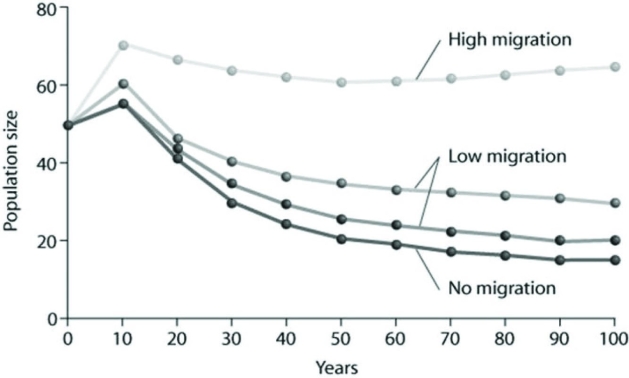 Based on the data provided, what factor of those listed below appears to be the most important in stabilizing the population from its initial size over the subsequent 100 years?
Based on the data provided, what factor of those listed below appears to be the most important in stabilizing the population from its initial size over the subsequent 100 years?A) The absence of migration
B) A low migration rate
C) A high migration rate
Answer