Question 2
(Multiple Choice)
Use the graph to answer the following question. 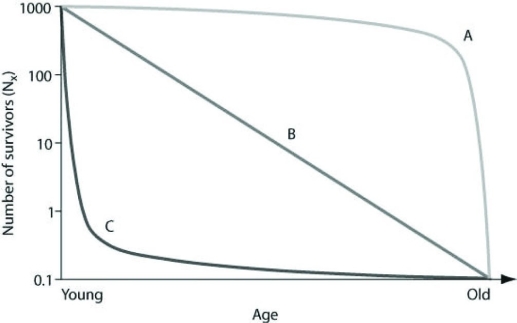 Which of the following examples are plausible explanations for a population that would produce curve A in the figure?
A) ongoing predation of pocket gophers throughout their lives
B) susceptibility of middle-aged humans to heart disease
C) higher predation success by wolves of older, slower elk
D) high seedling mortality in sunflowers
Answer
C