Course
Anatomy & Physiology
Study Pack
Set 25 Cycling Carbon
Question 1
(Multiple Choice)
Free
Which of the following equations is the chemical reaction for cellular respiration?
A)C6H12O6 + 6O2 6CO2 + 6H2O
B)6CO2 + 6H2O C6H12O6 +6O2
C)CaSiO3 +CO2 CaCO3 +SiO2
D)C6H12O6 + 6CO2 6O2 + 6H2O
Answer
Question 2
(Multiple Choice)
Free
Studies assessing the amounts of different carbon isotopes (12C, 13C, and 14C) in the atmosphere were important because they provided evidence that human activities were in fact adding CO2 to the atmosphere. This is an example of what type of relationship?
A)correlation
B)causation
C)conduction
D)antagonism
Answer
Question 3
(Multiple Choice)
Free
As shown in Figure 25.1 below, atmospheric CO2 levels oscillate throughout the year. 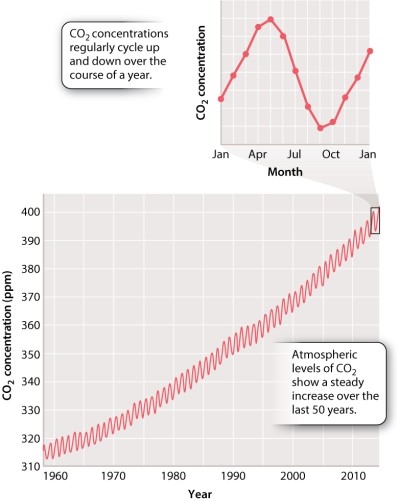 How would this trend change if it were spring for an entire year? Select the graph below that represents the atmospheric CO2 levels of an Earth with a full year of spring (assume you are in the Northern Hemisphere).
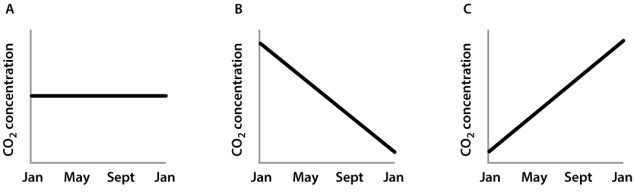
How would this trend change if it were spring for an entire year? Select the graph below that represents the atmospheric CO2 levels of an Earth with a full year of spring (assume you are in the Northern Hemisphere). A)graph A
B)graph B
C)graph C
Answer