Course
Evolution
Study Pack
Set 7 Mendelian Genetics In Populations Ii Migrationdrift Nonrandom Mating
Question 1
(Multiple Choice)
Free
If genetic drift is not accompanied by natural selection,mutation,or migration,then the frequencies of alleles will "wander" between 0 and 1.Using the accompanying figure,which of the following is an accurate statement? 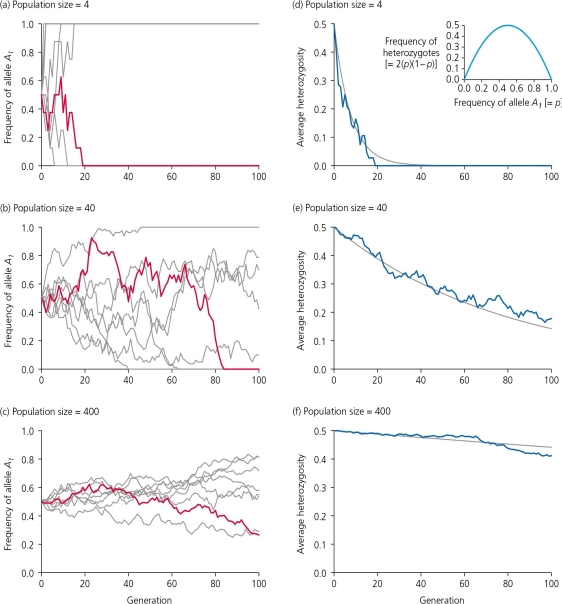
A) Random sampling error generates fluctuations in allelic frequencies over generations, so all populations-both simulated and real-have been found to follow the same evolutionary trajectory.
B) The effects of genetic drift are more immediate, and more pronounced, on small population sizes.
C) Genetic drift will have no long-term effect on allelic frequencies if the population numbers more than 40 individuals.
D) None of these is an accurate statement.
Answer
Question 2
(Multiple Choice)
Free
The accompanying figure details the possible outcomes in a scenario in which 10 zygotes are formed from a gene pool where frequency of the allele A1 is 0.6,and A2 is 0.4.This graph is shown here.According to this graph,the probability that the frequency of A1 will remain the same in the next generation is about ________. 
A) 8%
B) 12%
C) 16%
D) 18%
E) none of the above
Answer
Question 3
(Multiple Choice)
Free
The accompanying figure details the possible outcomes in a scenario in which 10 zygotes are formed from a gene pool where the frequency of the allele A1 is 0.6,and A2 is 0.4.This graph is shown here.According to this graph,the probability that the frequency of A1 will increase to 0.7 in the next generation is about ________. 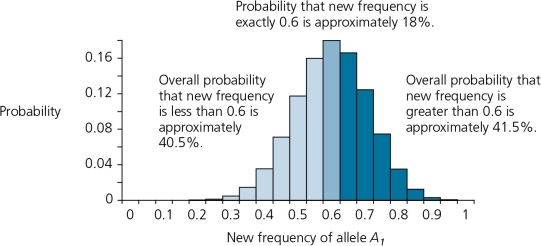
A) 8%.
B) 12%
C) 16%
D) 40%
E) 70%
Answer