Question 2
(Multiple Choice)
The accompanying figure details the possible outcomes in a scenario in which 10 zygotes are formed from a gene pool where frequency of the allele A1 is 0.6,and A2 is 0.4.This graph is shown here.According to this graph,the probability that the frequency of A1 will remain the same in the next generation is about ________. 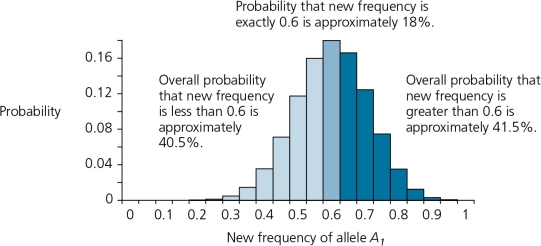
A) 8%
B) 12%
C) 16%
D) 18%
E) none of the above
Answer
D