Course
Biology Science
Study Pack
Set 23 Evolutionary Processes
Question 1
(Multiple Choice)
Free
Wikelski and Romero 2003) found that large marine iguanas had higher reproductive success than smaller iguanas did. However, the large iguanas were generally in poor body condition because they could not eat enough; at higher temperatures their foraging efficiency improved, allowing them to eat more. Thus, Wikelski and Romero hypothesize that iguana size will as global warming gradually increases air and water temperatures in the Galápagos Islands.
A) decrease
B) vary more
C) increase
D) stay the same
Answer
Question 2
(Short Answer)
Free
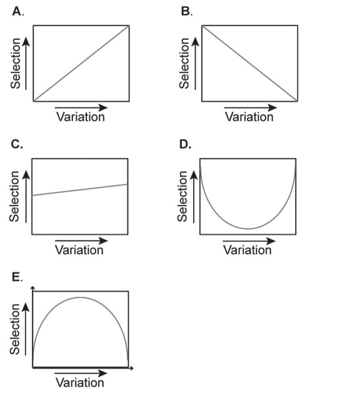
-Which of the graphs above best represents the relationship between the intensity of directional selection and the genetic variation present within a population?
Answer
Question 3
(Multiple Choice)
Free
Use the following information when answering the corresponding questions).
Researchers studying a small milkweed population note that some plants produce a toxin and other plants do not. They ident gene responsible for toxin production. The dominant allele T) codes for an enzyme that makes the toxin, and the recessive all
t) codes for a nonfunctional enzyme that cannot produce the toxin. Heterozygotes produce an intermediate amount of toxin. The genotypes of all individuals in the population are determined see chart) and used to determine the actual allele frequencies in the population.
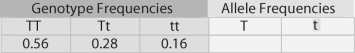 Figure 23.1
-Refer to Figure 23.1. Is this population in Hardy- Weinberg equilibrium?
Researchers studying a small milkweed population note that some plants produce a toxin and other plants do not. They ident gene responsible for toxin production. The dominant allele T) codes for an enzyme that makes the toxin, and the recessive all
t) codes for a nonfunctional enzyme that cannot produce the toxin. Heterozygotes produce an intermediate amount of toxin. The genotypes of all individuals in the population are determined see chart) and used to determine the actual allele frequencies in the population.
Figure 23.1-Refer to Figure 23.1. Is this population in Hardy- Weinberg equilibrium?
A) yes
B) No; there are more heterozygotes than expected.
C) No; there are more homozygotes than expected.
D) More information is needed to answer this question.
Answer