Course
Cell Biology
Study Pack
Set 17 Cytoskeleton
Question 1
(Multiple Choice)
Free
Which of the following statements about the cytoskeleton is FALSE?
A)The cytoskeleton is made up of three types of protein filaments.
B)The cytoskeleton controls the location of organelles in eukaryotic cells.
C)Covalent bonds between protein monomers hold together cytoskeletal filaments.
D)The cytoskeleton of a cell can change in response to the environment.
Answer
Question 2
(Multiple Choice)
Free
The graph in Figure 17-18 shows the time course of the polymerization of pure tubulin in vitro.Assume that the starting concentration of free tubulin is higher than it is in cells. 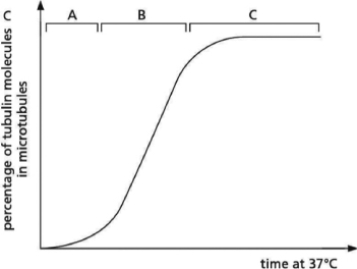 Figure 17-18
Three parts of the curve are labeled above it as A, B, and C.You conduct a similar in vitro tubulin-polymerization experiment, only this time you include purified centrosomes in your preparation.When you plot your data, which part of your graph should be most dissimilar to the curve shown in Figure 17-18?
Figure 17-18Three parts of the curve are labeled above it as A, B, and C.You conduct a similar in vitro tubulin-polymerization experiment, only this time you include purified centrosomes in your preparation.When you plot your data, which part of your graph should be most dissimilar to the curve shown in Figure 17-18?
A)A
B)B
C)C
D)None.The shape of my graph should be identical to the graph produced when tubulin is polymerized in the absence of purified centrosomes.
Answer
Question 3
(Multiple Choice)
Free
Which of the following statements about organellar movement in the cell is FALSE?
A)Organelles undergo saltatory movement in the cell.
B)Only the microtubule cytoskeleton is involved in organellar movement.
C)Motor proteins involved in organellar movement use ATP hydrolysis for energy.
D)Organelles are attached to the tail domain of motor proteins.
Answer