Course
Other
Study Pack
Set 11 Analysis Of Variance
Question 1
(Short Answer)
Free
Use the following sample data to answer the next questions. For a study on
Type 1 diabetes, medical graduate students subdivided the United States into four
study regions (Northeast, Southeast, Southwest, and Northwest). The students
randomly selected seven patients per region and recorded the number of times
during a randomly selected month that each patient used insulin shots to regulate
blood sugar levels. Use One-Way ANOVA at a .05 significance level to test the
claim that the means from the different regions are not the same.
Mean number of times patients used insulin shots to regulate blood sugar levels
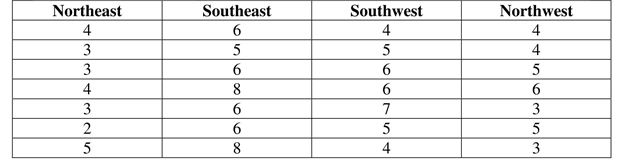
-Determine the value of the F test statistic.
Type 1 diabetes, medical graduate students subdivided the United States into four
study regions (Northeast, Southeast, Southwest, and Northwest). The students
randomly selected seven patients per region and recorded the number of times
during a randomly selected month that each patient used insulin shots to regulate
blood sugar levels. Use One-Way ANOVA at a .05 significance level to test the
claim that the means from the different regions are not the same.
Mean number of times patients used insulin shots to regulate blood sugar levels
-Determine the value of the F test statistic.
Answer
test stati...
View full Answer
Question 2
(True False)
Free
Determine whether the following statement is true or false.
-Assuming calculations for a One-Way ANOVA with equal sample sizes, if each data value in one of the samples is increased by a fixed amount, then any change in the F test statistic and the P-value is attributable only to the change in the sample mean.
-Assuming calculations for a One-Way ANOVA with equal sample sizes, if each data value in one of the samples is increased by a fixed amount, then any change in the F test statistic and the P-value is attributable only to the change in the sample mean.
Answer
Question 3
(Short Answer)
Free
Use the following technology display from a Two-Way ANOVA to answer the next
questions. Wildlife biologists studying beaver habitats measured the number
of beaver colonies per square mile identified at two randomly selected wetland
habitats, under three densities of tree growth (sparse, average, or dense growth).
Use a .05 significance level.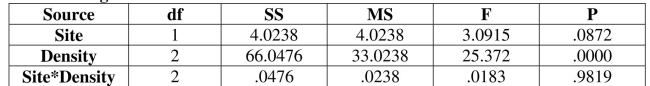
-For the density effect, state a conclusion about the null hypothesis.
Answer