Course
Other
Study Pack
Set 12 Nonparametric Statistics
Question 1
(Short Answer)
Free
Use the following sample data to answer the next questions. For a study on
Type 1 diabetes, medical graduate students subdivided the United States into four
study regions (Northeast, Southeast, Southwest, and Northwest). The students
randomly selected seven patients per region and recorded the number of times on
a randomly selected day that each patient used insulin shots to regulate blood
sugar levels. Use the Kruskal-Wallis Test at a .05 significance level to test the claim
that the regions have samples that come from populations with equal medians of
number of insulin shots.
Number of times patients used insulin shots to regulate blood sugar levels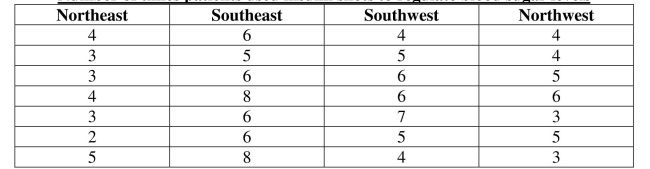
-Identify the critical value .
.
Type 1 diabetes, medical graduate students subdivided the United States into four
study regions (Northeast, Southeast, Southwest, and Northwest). The students
randomly selected seven patients per region and recorded the number of times on
a randomly selected day that each patient used insulin shots to regulate blood
sugar levels. Use the Kruskal-Wallis Test at a .05 significance level to test the claim
that the regions have samples that come from populations with equal medians of
number of insulin shots.
Number of times patients used insulin shots to regulate blood sugar levels
-Identify the critical value
.Answer
Question 2
(Essay)
Free
Use the following sample data to answer the next questions. Tracking
misdiagnoses by Emergency Room doctors, a sample of 200 patients revealed that
45 patients were misdiagnosed with indigestion instead of a heart attack. Use the
Sign test with a .05 significance level to test the claim that physicians correctly
diagnose a majority of heart attacks.
-State a conclusion about the null hypothesis and a final conclusion that addresses the original claim.
Answer
Reject  . The sample data supp...
View full Answer
Question 3
(Short Answer)
Free
Use the following sample data to answer the next questions. The paired data
consist of a random sample of the cost of regionally advertising (in thousands of
dollars) a certain pharmaceutical drug and the number of new prescriptions
written (in thousands). Use the Spearman's rank correlation coefficient to test for
a correlation between the cost of advertising and the number of new prescriptions
written. Use a significance level of
 .
.
-Identify the critical value .
.
consist of a random sample of the cost of regionally advertising (in thousands of
dollars) a certain pharmaceutical drug and the number of new prescriptions
written (in thousands). Use the Spearman's rank correlation coefficient to test for
a correlation between the cost of advertising and the number of new prescriptions
written. Use a significance level of
. -Identify the critical value
.Answer