Question 47
(Essay)
Refer to the figures.
Figure 1
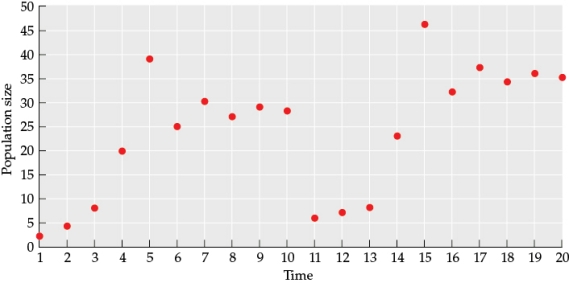 Figure 2
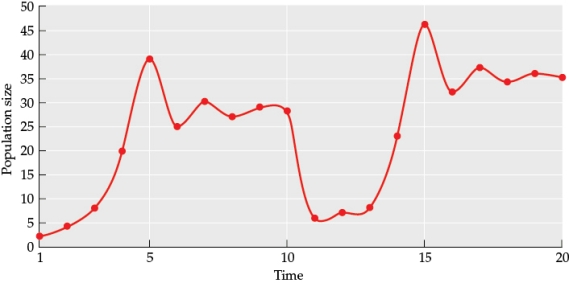
-What happened to the population between time 10 and 11? Based on the data prior to this point, what type of event most likely caused the change in the population size seen at that time? What additional data would you need to determine the underlying cause of the event?
Answer
The population crashed between time 10 a...
View full Answer