Question 9
(Multiple Choice)
Refer to the figure shown.
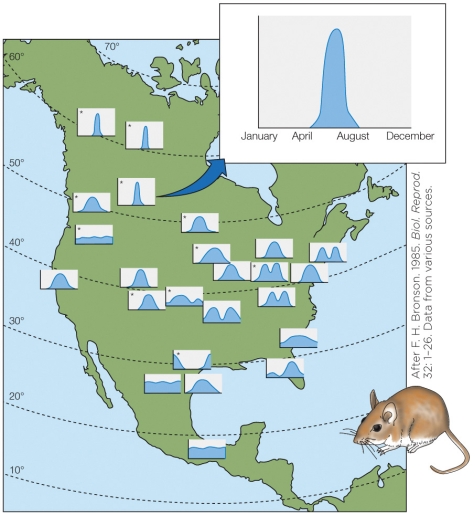 Which conclusion can be drawn from the information in the figure?
A) Populations at high latitudes reproduce during just 1-2 months.
B) High latitude populations breed all year long.
C) Populations at high latitudes show greater fecundity compared to populations at mid-latitudes.
D) Populations at high latitudes reproduce over a period of many months.
Answer