Question 8
(Multiple Choice)
Refer to the figure shown. 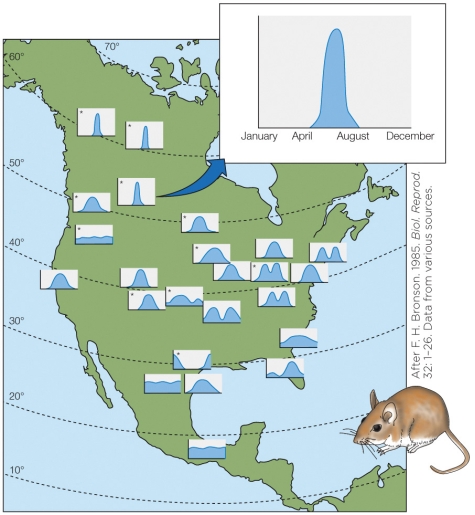 The graphs in the figure represent the
A) number of offspring produced in a given season.
B) number of copulating animals in a given season.
C) percentage of the population capable of reproducing.
D) percentage of pregnant females as a function of the season.
Answer