Question 7
(Multiple Choice)
Refer to the figure.
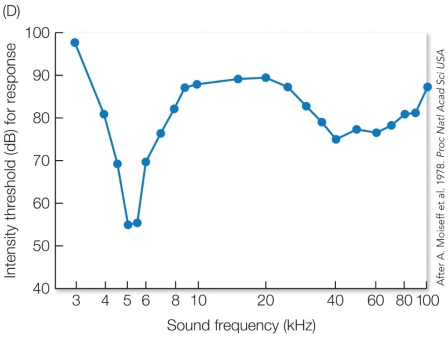 Based on the information in the graph, what would you predict is the sound frequency (kHz) of ultrasonic bat calls?
A) 3-kHz, because the intensity threshold is at its highest point and it is a low-frequency.
B) 5-kHz, because the intensity threshold is at its lowest point and it is a low-frequency.
C) 40-kHz, because there is a dip in the intensity threshold and it is a high-frequency.
D) 100-kHz, because the intensity threshold is high, and it is the highest frequency recorded.
Answer