Question 45
(Short Answer)
In the following schematic diagram, which curve (A to D) do you think better shows the qualitative relationship between the affinity of a developing T cell's TCR for self-peptide-MHC complexes in the thymus and the survival chance of the cell? 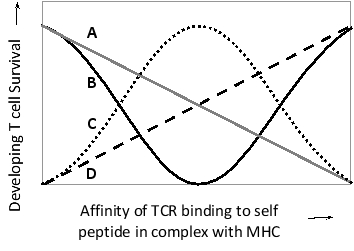
Answer
Too low or too high...
View full Answer