Question 59
(Multiple Choice)
In the following graph that shows changes in the lengths of two microtubules over time, which time point corresponds to a catastrophe for both microtubules? Which trace corresponds to a microtubule with greater dynamic instability? 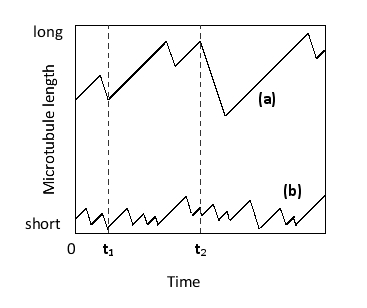
A) t₁; trace (a)
B) t₁; trace (b)
C) t₂; trace (a)
D) t₂; trace (b)
Answer