Question 35
(Short Answer)
In the following graph, the elongation rate of pure actin filaments as a function of actin subunit concentration is shown as a dashed line. Which one of the other five lines (A to E) would you think better shows what happens when a plus-end capping protein such as CapZ is present? 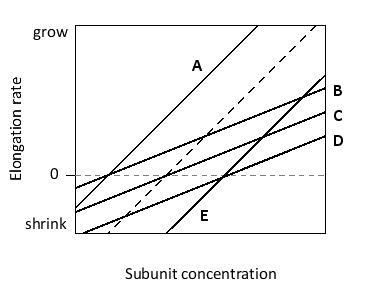
Answer
With pure subunits, the (dashed) line r...
View full Answer