Question 63
(Multiple Choice)
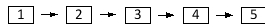
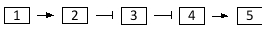
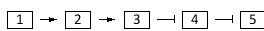
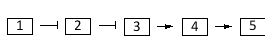
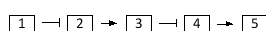
In the following schematic diagrams of ethylene signaling in plants, 1 denotes ethylene, 2 denotes ethylene receptor, 3 denotes CTR1, 4 denotes EIN3, and 5 represents the expression of ethylene-responsive genes. Which diagram better depicts the signaling pathway? Activation and inhibition are indicated as normal and blunt arrows, respectively.
A)
B)
C)
D)
E)
Answer