Question 19
(Short Answer)
You grow a tumor-derived cell line in a suspension culture, in which the cells are seen either as single cells or in cell clusters. The cells have been engineered to express green fluorescent protein (GFP) under the control of the mitogen-activated protein kinase (MAP kinase) pathway. To your culture media, you add different concentrations of fibroblast growth factor (FGF)-which is known to activate the MAP kinase pathway in these cells-and briefly incubate the cells before harvesting them. You also collect, under a microscope, hundreds of individual cell clusters from each suspension. You then disaggregate the cells in all of your samples and use a FACS (fluorescence-activated cell sorting) machine to measure the GFP signal intensity in individual cells. Finally, you plot the results as histograms, as shown below. 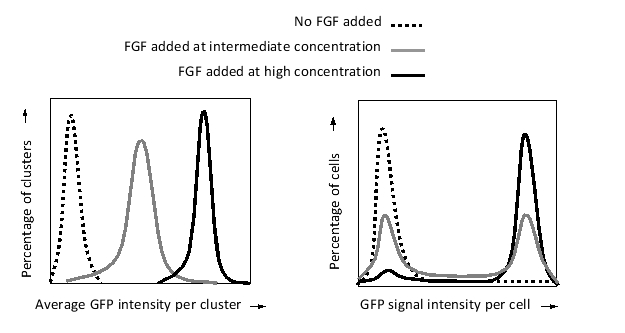
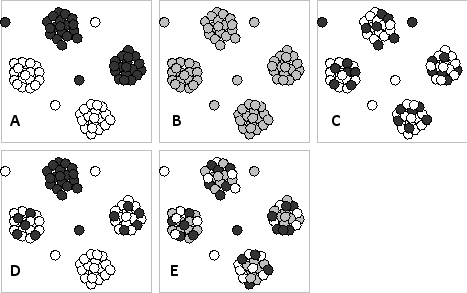
According to these results, which of the following schematic drawings better represents the expression of GFP (a proxy for MAP kinase activation) in the culture after intermediate FGF stimulation? In these drawings, higher GFP expression is represented by a darker shade.
Answer
The histograms from the FACS data show ...
View full Answer