Question 15
(Short Answer)
In the following graphs, the cellular response, as measured in real time by the concentration of a certain active effector protein, is plotted over time for five cell types (A to E) that are treated with three different concentrations of a signal molecule. During the time period indicated by the horizontal gray bar, the signal molecule is present in the culture media at a concentration of 1 nM (dotted curve), 5 nM (gray curve), or 25 nM (solid curve). Answer the following question(s) based on these graphs.
-Which of the cell types A to E shows the fastest signal adaptation?
A)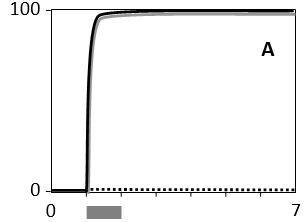
B)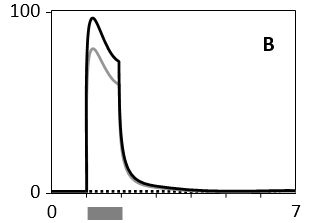
C)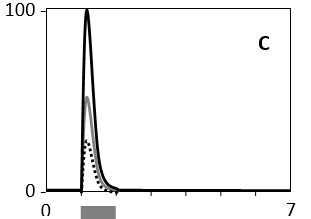
D)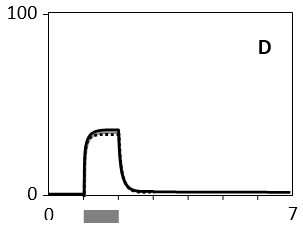
E)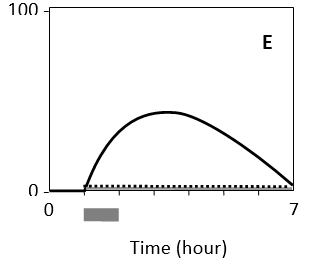
Answer
This cell type redu...
View full Answer