Question 65
(Multiple Choice)
RNA-seq and ribosome profiling experiments have been carried out on the same cells. The following simplified graphs show the results for the same genomic region containing a gene with three exons. Which graph (1 or 2) do you think corresponds to the RNA-seq results? What feature is represented by the arrow? 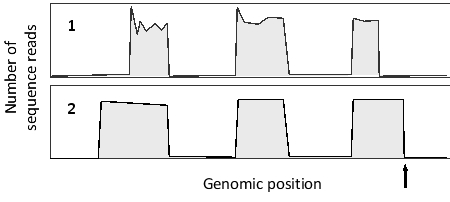
A) Graph 1; stop codon
B) Graph 1; polyadenylation site
C) Graph 2; stop codon
D) Graph 2; polyadenylation site
Answer