Question 6
(Multiple Choice)
In the following diagram showing the distribution of thermal energy in a population of substrate molecules, the energy thresholds indicated by numbers represent ... 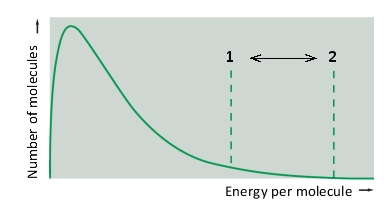
A) the activation energy at high and low temperature.
B) the reaction rate at high and low pH.
C) the activation energy with and without an enzyme.
D) the reaction rate at high and low substrate concentrations.
E) the activation energy at high and low substrate concentrations.
Answer