Question 11
(Multiple Choice)
A gardener applies a specific fungicide to her plot that kills all mycorrhizal fungi. Which of the graphs below depicts changes in the amount of phosphorus in the soil after application of the fungicide? 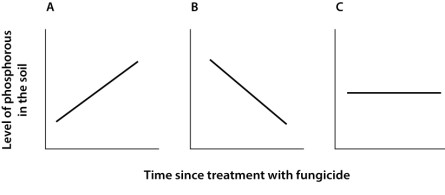
A)graph A
B)graph B
C)graph C
Answer