Question 11
(Multiple Choice)
Figure 49.7 shows observed temperature changes versus those predicted for natural causes of increased temperature and natural plus anthropogenic causes of increased temperature. How would the lines be different if humans were predicted to have no impact on global temperatures? 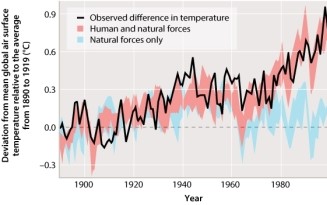
A)The line for natural causes would be the same as that for anthropogenic plus natural causes.
B)All three lines on the graph would be identical.
C)Observed data would match the zero line on the graph, and the natural causes and anthropogenic plus natural causes lines would fluctuate above the zero line.
D)The line for natural causes would be above the zero line, and the line for natural plus anthropogenic causes would be below the zero line on the graph.
Answer