Question 25
(Multiple Choice)
Using Figure 1.4,which of the following statements are accurate? 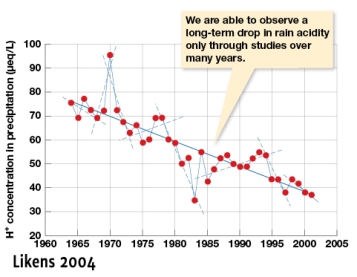
A) The overall trend shows a negative effect of time on hydrogen ion concentration in precipitation
B) From 1965 to 1975 the trend is flat
C) From 1965 to 1975 the trend is a decline in hydrogen ion concentration
D) The data need to be looked at year by year and not over this long a period
Answer