Question 24
(Multiple Choice)
The graph below shows the growth of a population of Paramecium caudatum.The greatest amount of daily growth occurred when the population was at approximately ________ percent of its carrying capacity. 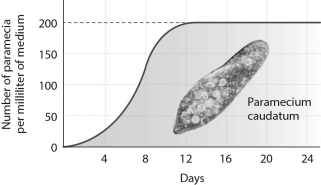
A) 10
B) 25
C) 50
D) 100
Answer