Question 18
(Multiple Choice)
Figure 6.2
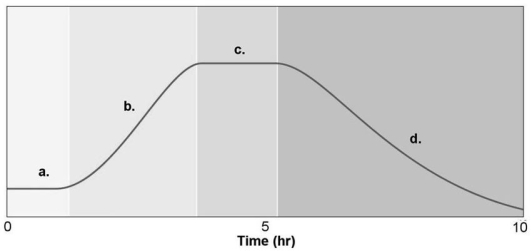
-Figure 6.2 shows a typical bacterial growth curve with the y-axis indicating the log of the number of bacteria and the x-axis indicating time in culture.In the figure,which section (or sections)shows a growth phase where the number of cells dying equals the number of cells dividing?
A)a
B)b
C)c
D)d
E)a and c
Answer