Question 29
(Multiple Choice)
The graph below depicts the amount of energy involved over the course of a chemical reaction. 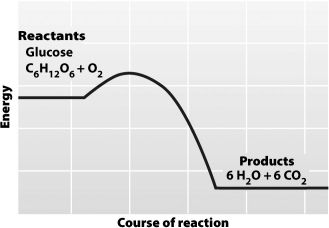
The graph indicates that
A)the products of this reaction have more energy than the substrates.
B)this reaction requires an input of energy to convert glucose and O₂ to H₂O and CO₂.
C)this reaction can only run in one direction (from left to right on the graph).
D)this reaction occurs only in the presence of an enzyme.
Answer