Question 63
(Multiple Choice)
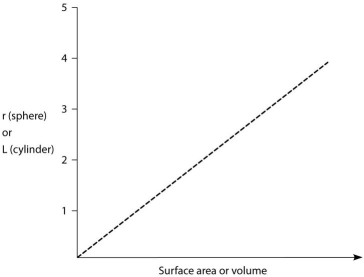
-Both axes of the graph are linear.Thus,the shape of the line plotted on this graph most accurately depicts the
A)volume of a sphere as the radius, r, increases.
B)surface area of a sphere as the radius, r, increases.
C)volume of a cylinder as length, L, increases.
D)surface area of a cylinder as length, L, increases.
Answer