Question 72
(Multiple Choice)
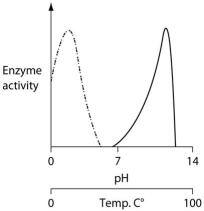
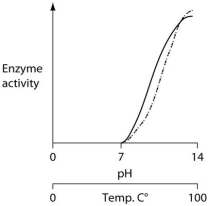
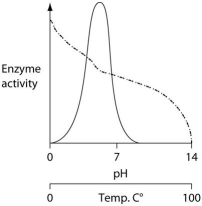
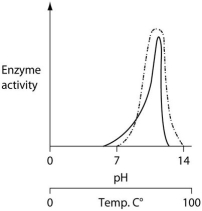
Consider the thermoacidophile,Sulfolobus acidocaldarius.Which of the following graphs most accurately depicts the expected temperature and pH profiles of its enzymes? (Note: The horizontal axes of these graphs are double,with pH above and temperature below.)

A)
B)
C)
D)
Answer