Question 72
(Multiple Choice)
Use the following figure to answer the questions below.
In a very large population,a quantitative trait has the following distribution pattern:
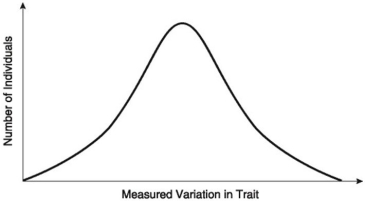
-What would be the most probable cause for a population depicted in the figure above to shift both to the left and to the right?
A)when large size is important
B)when there is an extreme environmental change
C)when there are few predators
D)when there are differences in the size of food items available to members of the same species
E)when the more common alleles are lost
Answer