Question 10
(Multiple Choice)
Interpret the graph below.
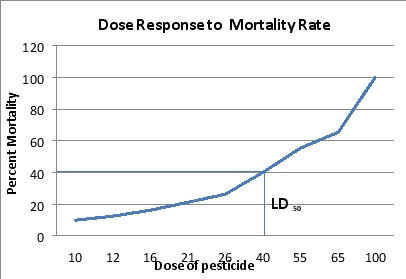
A) The graph shows that at a 100% dose of the pesticide the entire population will survive.
B) The graph shows that at the dose of 40%, 40% of the population dies.
C) The graph shows that at the dose of 40%, 100% of the population dies.
D) The graph shows the LD50 which represents the dose at which 40% of the population survives.
E) The graph shows the LD50 which represents the dose at which the population can handle the dose without any negative effects.
Answer