Question 26
(Essay)
Refer to the figure below showing the US MSW generation rates from 1960 to 2010. Explain the trend in per capita waste generation from 1960-1990 compared to 1990-2010.
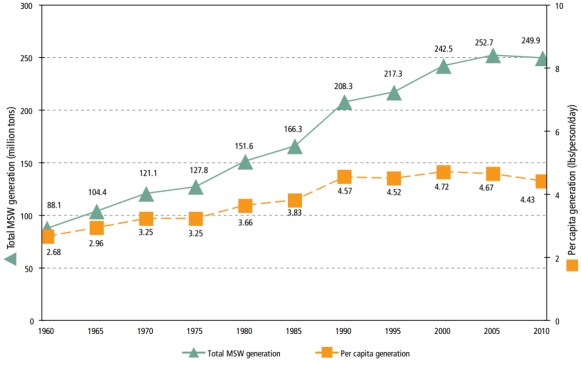 (Source: http://www.epa.gov/osw/nonhaz/municipal/msw99.htm)
Answer
From 1960-1990, per capita waste generat...
View full Answer