Question 21
(Multiple Choice)
Refer to the figure.
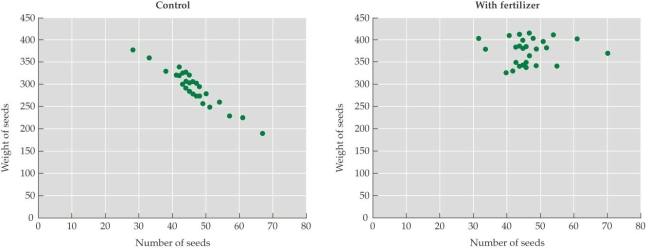
- Seedlings of an annual plant were split into two equal treatment groups; in one group, extra fertilizer was added, and in the other group (the control group), no additional fertilizer was added. The numbers of seeds and the average weight of the seeds from each individual plant were monitored, and these data were plotted (each point represents an individual plant). According to the figure, it appears that fertilizer treatment _______ seed size and _______ seed number.
A) increased; had no effect on
B) increased; increased
C) had no effect on; decreased
D) decreased; increased
Answer