Question 31
(Multiple Choice)
Refer to the figure.
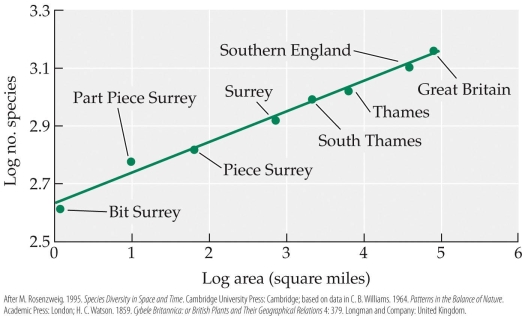 The data shown in the figure were log-transformed before plotting. How would this plot look different if the original untransformed data were plotted instead?
A) The fitted line would extend from the upper left to lower right.
B) The fitted curve would extend downward to the right, becoming increasingly steep.
C) The fitted curve would extend upward to the right, becoming increasingly steep.
D) The fitted curve would extend upward to the right, becoming decreasingly steep.
Answer