Question 28
(Multiple Choice)
Refer to the figure.
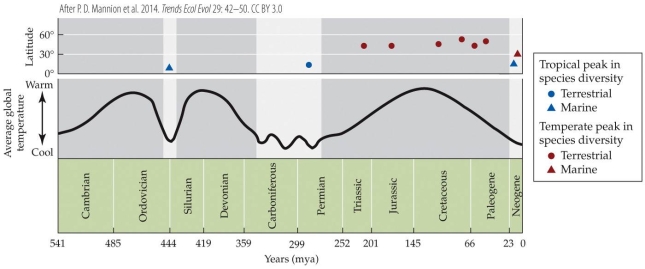 Which of the following statements is most clearly supported by the data in the figure?
A) The current latitudinal gradient in species richness is likely due to much higher speciation rates in the tropics than in temperate regions over millions of years.
B) The current latitudinal gradient in species richness is likely due to greater environmental stability in the tropics across hundreds of millions of years.
C) The current latitudinal gradient in species richness could invert if average global temperature decreased substantially.
D) The current latitudinal gradient in species richness could invert if average global temperature increased substantially.
Answer