Question 8
(Multiple Choice)
Refer to the figure.
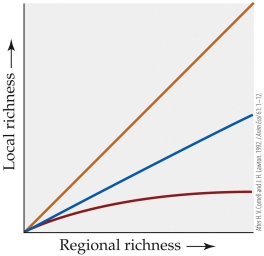 In the figure, assume that the top line has a slope of 1 and the middle line a slope of 0.7. Which of the three relationships shown illustrates a scenario in which local processes most strongly limit species richness in a community?
A) Top
B) Middle
C) Bottom
D) Impossible to say without knowing the beta and gamma diversity for each scenario
Answer