Question 66
(Multiple Choice)
Refer to the map.

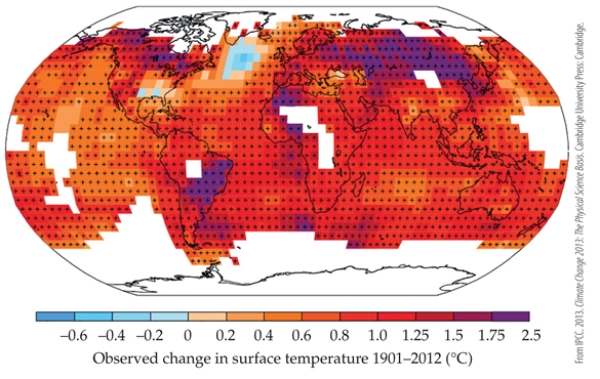 The map shows the temperature change in °C across different regions of the globe from the averages of 1901‒2012. According to the map, how much warmer is Paris in 2012 than in 1901?
A) 0.2 °C
B) 0.8 °C
C) 1.5 °C
D) 2.5 °C
Answer