Question 48
(Multiple Choice)
Refer to the figure shown.
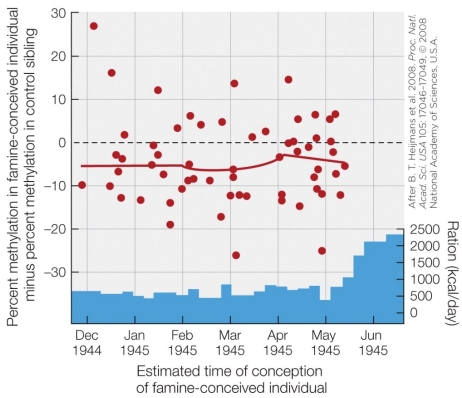 The data in the figure show that DNA methylation
A) correlates with caloric intake.
B) does not change during a famine.
C) of individuals conceived during a famine was lower than that of siblings conceived during no famine.
D) of individuals conceived during a famine was higher than that of siblings conceived during no famine.
Answer