Question 59
(Multiple Choice)
Refer to the figure showing regulation and conformity in two species of related fish.
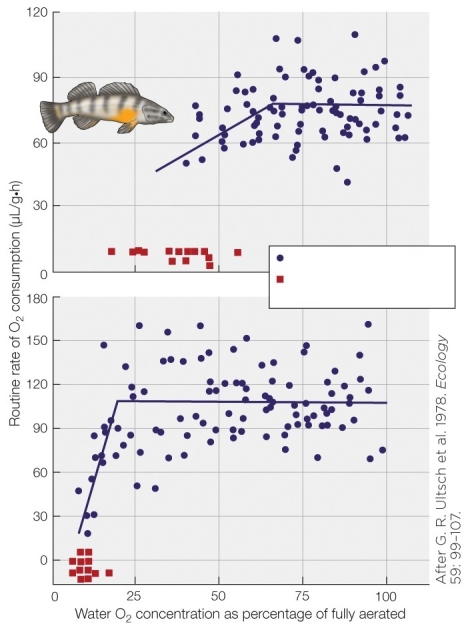 According to the figure, what do the dots scattered around the lines represent?
A) Mean rates of oxygen consumption of different species
B) Individual measurements of rate of oxygen consumption in one species
C) Death rates
D) Individual measurements of oxygen consumption in many species
Answer