Question 54
(Multiple Choice)
Refer to the figure shown.
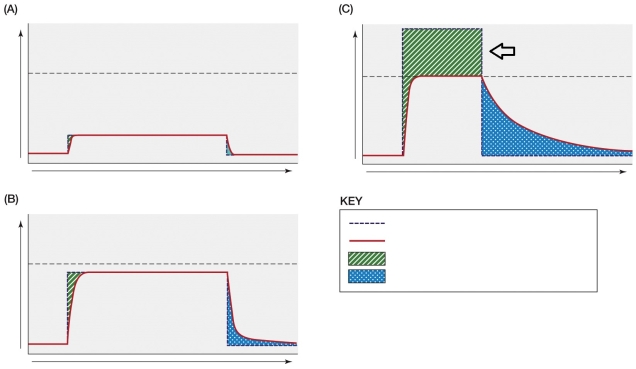 Where is the maximum oxygen consumption represented on the graphs?
A) The horizontal dashed line
B) The shaded area at the beginning of the solid line curve
C) The shaded area at the end of the solid line curve
D) The solid curve line
Answer