Question 18
(Multiple Choice)
Refer to the figure shown.
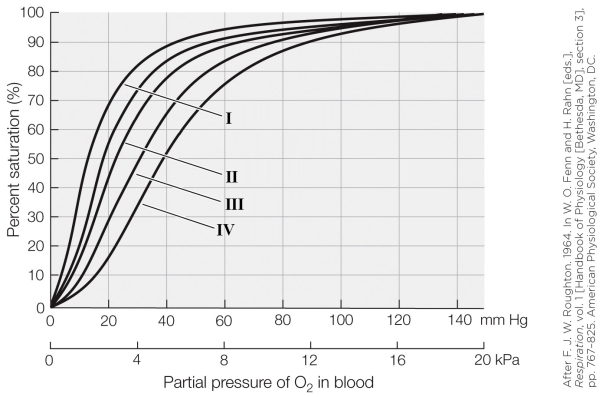 On the graph, which oxygen dissociation curve represents a very high blood pH (e.g., 7.6)?
A) I
B) II
C) III
D) IV
Answer