Question 61
(Multiple Choice)
Refer to the figure shown.
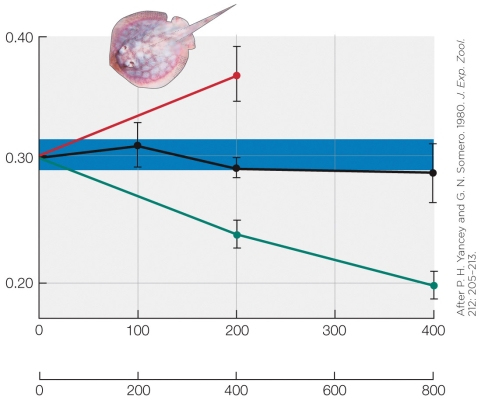 The shaded area on the graph represents the
A) rate of enzyme catalysis.
B) normal enzyme substrate affinity.
C) normal range of osmolarity.
D) optimal metabolic rate.
Answer