Question 9
(Multiple Choice)
Refer to the figure.
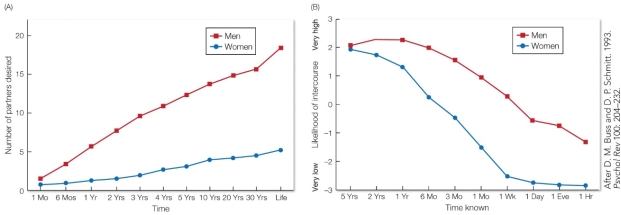 Part A shows the number of sexual partners men and women report wanting over different periods of time, and Part B shows men's and women's estimates of the likelihood of agreeing to sexual intercourse with an attractive partner they have known for varying lengths of time. Based on this study, we can conclude that men and women
A) differ in their mate preferences, leading to sexual conflict.
B) differ in their mate preferences, leading to reproductive conflict.
C) differ in their mate preferences in the short-term but align in the long-term.
D) align in their mate preferences overall.
Answer