Question 25
(Short Answer)
The qualitative graph below shows the molecular changes accompanying vernalization in the flowering plant Arabidopsis thaliana. Indicate which curve (A to D) in the graph better represents the temporal changes in each of the following variables. Your answer would be a four-letter string composed of letters A to D only, with each letter used once, e.g. BACD.
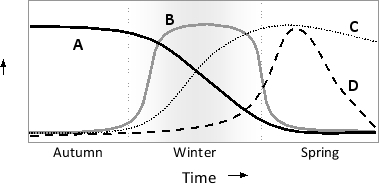
( ) Level of Coolair noncoding RNA
( ) Level of Flowering locus C (FlC) gene product (transcriptional repressor)
( ) Level of Flowering locus T (Ft) gene product (transcriptional activator)
( ) Level of repressive chromatin marks at the FlC locus
Answer
As Coolair levels (curve B) peak durin...
View full Answer