Question 33
(Multiple Choice)
The following graph qualitatively represents the gradients of Nodal and Lefty gene products in an early frog embryo. The position along which primary axis is defined by these gradients? Which curves correspond to these two proteins? 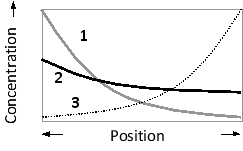
A) D-V axis; curves 1 and 2
B) D-V axis; curves 1 and 3
C) A-V axis; curves 1 and 2
D) A-V axis; curves 1 and 3
Answer