Question 5
(Short Answer)
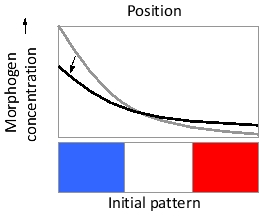
Imagine a morphogen gradient established from left to right in a field of cells in a developing tissue, as shown in the following schematic diagram. Below a first threshold of morphogen concentration, cells do not respond to the morphogen and express gene "red" by default. Cells exposed to morphogen concentrations above this threshold respond by expressing gene "white" instead, while those exposed to even higher concentrations, above a second threshold, express gene "blue." As shown, the initial pattern resembles a French flag with equally wide blue, white, and red expression domains. With no other change, if the diffusion rate of the morphogen is increased (by a modification that decreases its affinity for heparan sulfate proteoglycans, for example), the gradient profile changes from the gray curve to the black curve, as indicated. Under this new condition, indicate whether each of the following would be expected to increase (I), decrease (D), or remain unchanged (U) in its range. Your answer would be a three-letter string composed of letters I, D, and U only, e.g. UUI.
( ) Blue expression domain
( ) White expression domain
( ) Red expression domain
Answer
I
D
Changes in parameters such as diffu...
D
Changes in parameters such as diffu...
View full Answer