Question 14
(Short Answer)
Which of the following simplified diagrams better shows the changes in the concentrations of three major cyclin-Cdk complexes (G?/S-Cdk, S-Cdk, and M-Cdk) in the cell in different stages of the cell cycle? 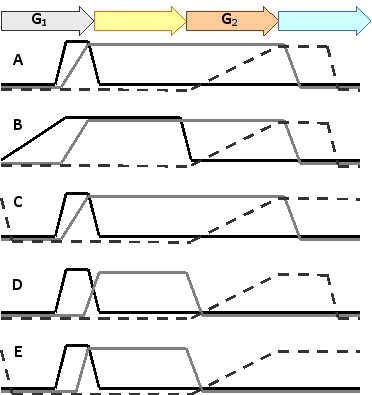
Answer
The G1/S-Cdk activity (solid black curve...
View full Answer