Question 91
(Short Answer)
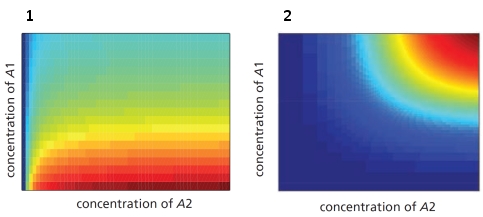
In the schematic graphs below, the red color indicates high gene expression and blue color indicates low gene expression. The expression level is plotted as a function of the concentrations of two transcription regulatory proteins, A1 and A2. Which graph (1 or 2) do you think corresponds to an "AND NOT" combinatorial logic? Write down 1 or 2 as your answer.
Answer
Graph 1 corresponds to an AND...
View full Answer